
Understanding a business ecosystem is essential for all marketers to gain a competitive advantage.
As a marketer and founder of Ecomap, Tobias Straumann have spent a great deal of time understanding markets and the critical information needed to represent best, interpret, and communicate the essence of a market to make strategic, tactical, and operational decisions.
What is Ecomap?
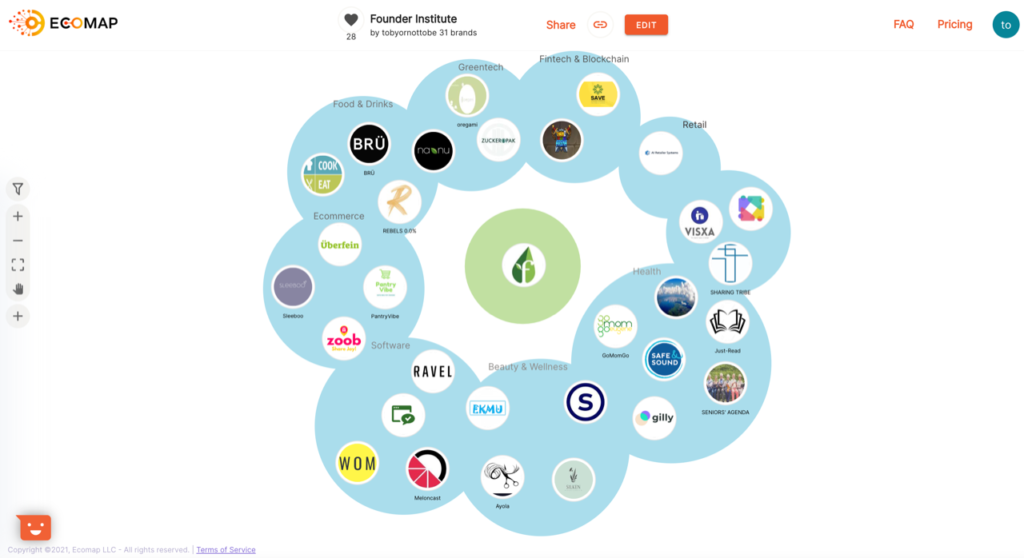
Ecomap takes inspiration from natural ecosystems to represent complex business networks, connections, and competitors in an easy-to-read business landscape.
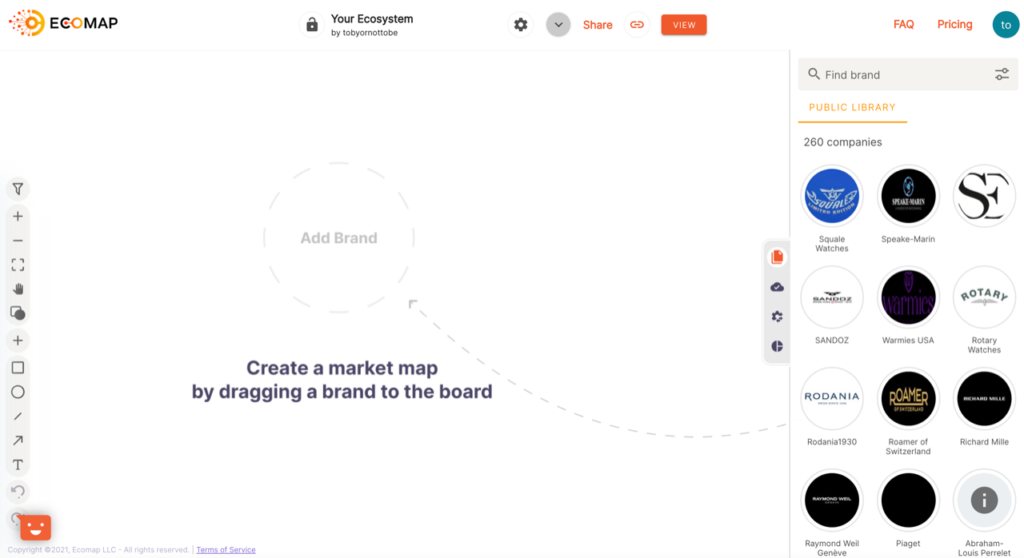
As marketers, we have spent much time looking at markets and understanding the relationships between suppliers, competitors, complementors, potential vendors, and other stakeholders. However, we have found that it is complicated and time-consuming and impossible to visualize in a static representation. Therefore, we decided to find a solution to map complex networks, the stakeholders and important industry data an interactive dynamic format.
Interactive mapping provides many benefits
An ecosystem includes many actors, all connected somehow, and it is almost impossible to draw the boundaries of the system.
There are many market players, from competitors to suppliers and substitutes to subsidiaries, all of whom influence a company’s strategic, tactical, and operational decisions. Yet it is complex and time consuming to gain an understanding of who competitors’ suppliers and distributors are, who supplies them, or which competitors cross industries and have interests in other sectors.
When this information is needed, it is best to break it down into a business landscape and categorize companies by industry or business type. Here, it becomes clear which companies operate in which areas of the industry, and these relationships begin to emerge.
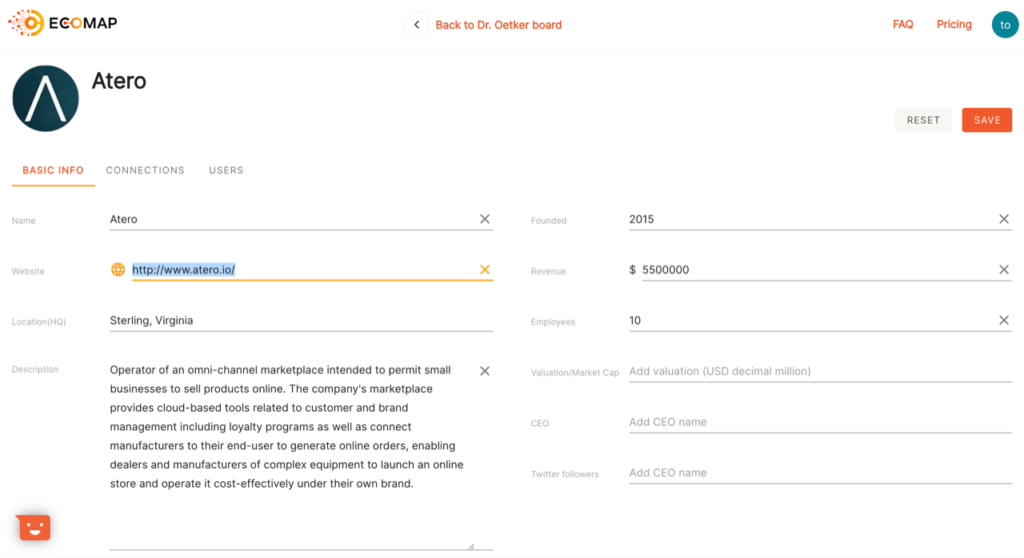
Unfortunately, in the fast-paced world we live in today, this is not enough, as the name, sector and relationships only skim the surface of understanding. More information is needed about the companies within the ecosystem, such as ownership structure, revenue, or links to their online activities.
Ecomap creates two-dimensional market landscapes that can be printed and added to reports to provide a valuable understanding of the industry.
Still, the real advantage is the three-dimensional dynamic mapping feature.
This means that industry players include deeper information such as their annual revenue, social media activity, number of employees, and year established. In addition, users can create links between companies and industries to get a complete overview of their industry, eliminating the need for tedious online searches and large, complex spreadsheet databases.
Providing market mapping information in an interactive format removes complexity and creates space for understanding. Ecomap provides the ability to add stakeholders that influence an ecosystem and filter them based on key industry metrics, such as revenue, employees, social followers, or year founded.
The map, therefore, not only shows the current market situation but also enables the investigation of “what-if” scenarios. For example, the mappers can ask what would happen if some companies left or entered a market or if others relocated their region.
By making seemingly minor adjustments to a map, the tables and diagram tool will identify the impact of industry alterations, eliminating the need for complex calculations for scenario planning because the application does the problematic work immediately.
Who benefits from Interactive ecosystem mapping?
Marketers, researchers, and strategic decision makers alike benefit from Ecomap’s unique interactive mapping capabilities. Markets benefit from the visualization of complex markets and the resulting understanding of market changes.
In addition, the application provides the perfect foundation for obtaining and storing market information that researchers can use to communicate research findings and recommendations. The industry overview is used as a fundamental tool for strategic decision makers to create a roadmap based on current and forecast market behaviour.
How do we have such a large vault of information?
Ecomap has compiled an extensive database of current and historical market data.
The application uses public and privately available databases as well as crawlers to collect, analyse and categorize information so that the end-user can retrieve and display it in a simple and understandable layout.
How much do market insights cost?
Traditional methods of obtaining market overviews and reports are either time consuming or costly. Market researchers, for example, charge by the hour and can spend weeks collecting, analysing and presenting reports.
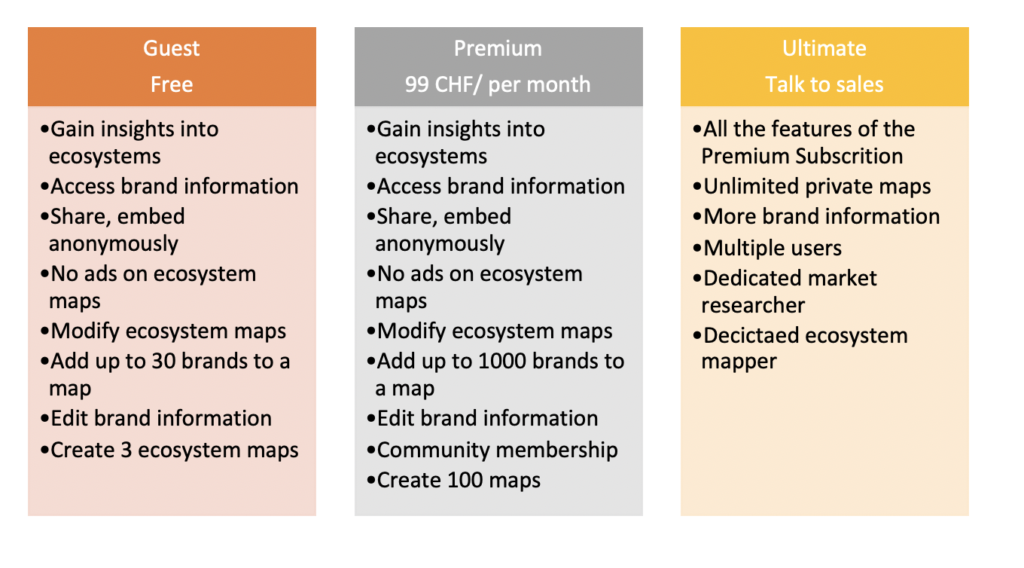
On the other hand, if you prepare the work yourself, you will redirect your time, focus and energy from other important tasks. Therefore, Ecomap strives to create a pricing model that considers these factors and offers three options at a fair price.
Have a try for yourself at ecomap.io or schedule a demo with here.